DuckDB’s
memory_limitonly covers its buffer manager. The engine as well as extensions may allocate memory outside the buffer manager. We traced an untracked memory allocation in duckdb-avro that caused OOM kills on our workload. Two factors led to the OOM kills: 1) duckdb-avro reads whole Avro files into memory, and 2) jemalloc does not return freed pages to the system immediately. Removing either factor prevented the OOM kills.
We run a Java service that loads Avro files into Iceberg tables with an in-process DuckDB. Each run opens one DuckDB instance and runs many table loads on it in parallel.
What One Load Looks Like
A load moves one batch of Avro files into one Iceberg table. The files sit in object storage, and the Iceberg
catalog is attached to DuckDB as lake.
First, a temp view over the batch’s files:
CREATE TEMP VIEW stage AS
SELECT * FROM read_avro([
    's3://staging/orders/batch-42/part-000.avro',
    's3://staging/orders/batch-42/part-001.avro'
]);
An APPEND load inserts the batch as is:
INSERT INTO lake.sales.orders
SELECT * FROM stage;
A MERGE load first keeps the newest row per key in a temp table, then upserts it into the target:
CREATE TEMP TABLE stage_latest AS
SELECT * FROM stage
QUALIFY row_number() OVER (PARTITION BY order_id ORDER BY updated_at DESC) = 1;

MERGE INTO lake.sales.orders AS t
USING stage_latest AS s
ON t.order_id = s.order_id
WHEN MATCHED THEN UPDATE SET status = s.status, amount = s.amount, updated_at = s.updated_at
WHEN NOT MATCHED THEN INSERT (order_id, status, amount, updated_at)
    VALUES (s.order_id, s.status, s.amount, s.updated_at);
A run does this for many tables at once. In the runs in this post, 14 loads run in parallel, each reading about 0.9 GB of Avro.
How DuckDB Manages Memory
DuckDB tracks query memory in a buffer manager:
- The limit is
memory_limit, 80% of RAM by default. - Cached table data, temp tables, hash tables and sort runs are tracked in the buffer manager.
- At the limit, DuckDB spills to disk. If it cannot spill enough, the query fails with DuckDB’s
Out of Memory Error.
Other allocations, by the engine or by extensions, are not tracked. DuckDB does not document how much memory to leave for them, and a DuckDB pull request that fixed kernel OOM kills puts the problem plainly:
“
memory_limittherefore bounds live buffers but not RSS, and a cgroup limit set with the usual headroom abovememory_limitis not enough.”
In our measurements, with the allocator returning freed memory at once, untracked memory was under 0.5 GiB plus 0.5 GiB per DuckDB thread. That holds only as long as no extension allocates something large outside the buffer manager.
duckdb-avro Reads Whole Files
read_avro opens each file by reading all of it into one buffer
(AvroReader::AvroReader,
at the commit DuckDB v2.0.0 ships):
auto file_handle = fs.OpenFile(this->file, flags);
auto total_size = file_handle->GetFileSize();

local_buffer = Allocator::DefaultAllocator().Allocate(total_size);
fs.Read(*file_handle, local_buffer.get(), total_size);

avro_file_reader_memory(const_char_ptr_cast(local_buffer.get()), total_size, &reader);
- The buffer is the size of the file and lives as long as the file’s scan.
- It comes from
Allocator::DefaultAllocator(), not the buffer manager, so it is not tracked. - The extension is a separate library with its own copy of DuckDB’s allocator.
How jemalloc Returns Memory
On Linux, DuckDB allocates through its own bundled copy of jemalloc:
- jemalloc splits the heap into arenas and pins each thread to one. Memory freed in one arena is reused only by threads on that arena.
- DuckDB sets the number of arenas (
narenas) to the number of CPU cores jemalloc sees. In a container that is the host’s cores, not the container’s CPU quota: 8 arenas in our runs, with 4 DuckDB threads. - Freed pages are not returned to the kernel at once. They stay resident for a decay period (
dirty_decay_msandmuzzy_decay_ms, 1 s each in DuckDB), so a later allocation can reuse them cheaply. - Both can be changed with the
DUCKDB_JE_MALLOC_CONFenvironment variable, read when DuckDB’s library loads.
Freed pages count against the container but not against memory_limit. The same pull request describes how
they pile up:
“when a buffer is freed during spilling jemalloc keeps its pages as dirty extents until the arena’s one second decay runs, and decay only runs when that arena is touched again. With one arena per CPU and ten threads churning through gigabytes of blocks, the freed-but-resident set grows to a large fraction of the limit.”
That pull request makes DuckDB flush its allocator when freed memory would push it past memory_limit, and it
is in DuckDB v2.0.0, the version in this post. It flushes DuckDB’s own allocator only, not the copy inside the
Avro extension.
Why the Container Was Killed
We sized the container, set memory_limit below it, and expected DuckDB to spill to disk when the loads did not
fit.
Instead, the kernel killed the container. DuckDB never spilled.
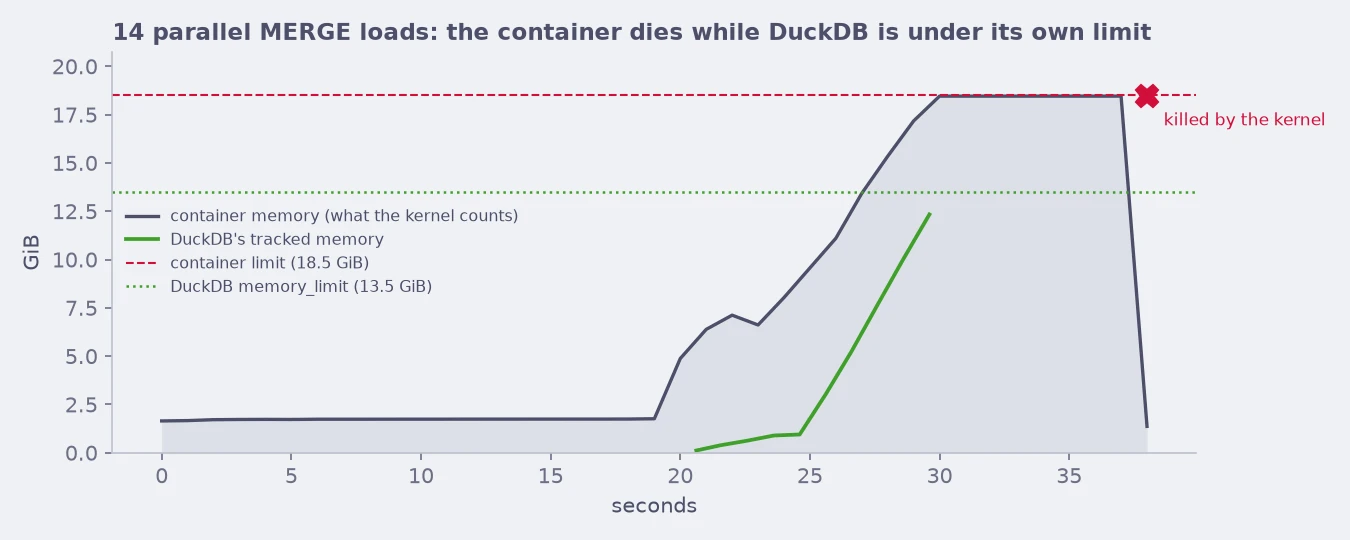
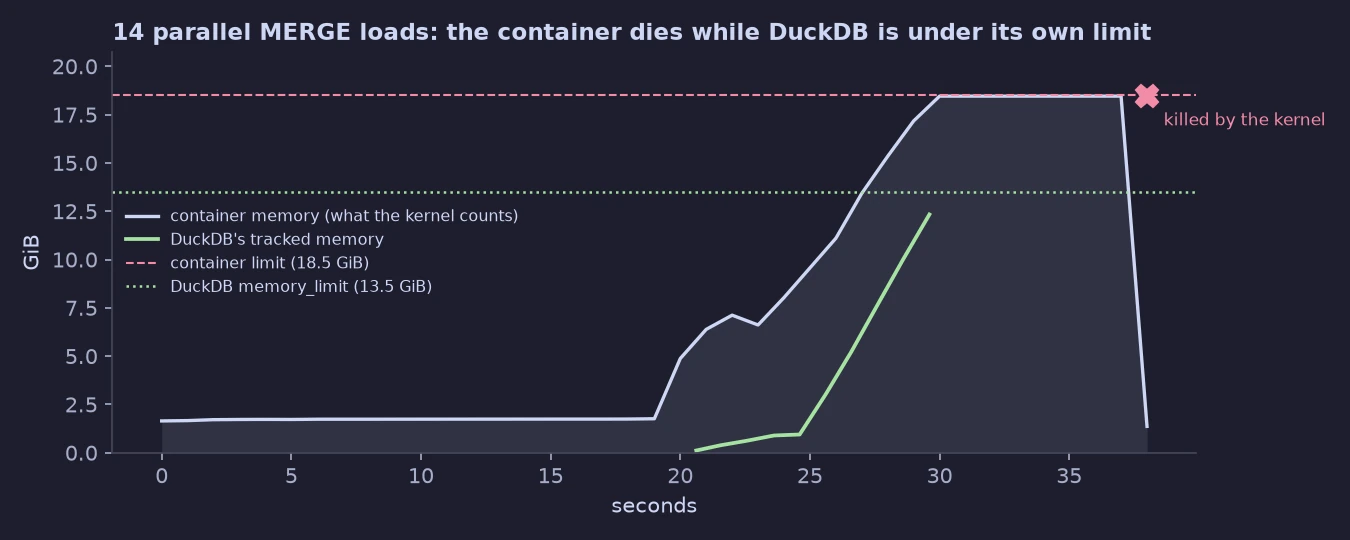
Fourteen parallel loads that read and MERGE ~0.9 GB of Avro each. The dark line is the container’s anonymous
memory, which is what the kernel enforces. The green line is DuckDB’s own count (duckdb_memory()). The container
reaches its 18.5 GiB limit while DuckDB counts 12.3 GiB, under its 13.5 GiB memory_limit, so DuckDB has no reason
to spill.
Two factors combined:
- duckdb-avro reads whole files into memory. Each open file is a buffer of 64–128 MiB outside the buffer manager, so DuckDB neither counts it nor spills it.
- jemalloc keeps freed pages resident. When a file’s scan finishes, its buffer is freed into one arena and stays resident for up to a second. The next file may be opened by a thread on another arena, which takes new pages instead of reusing the freed ones.
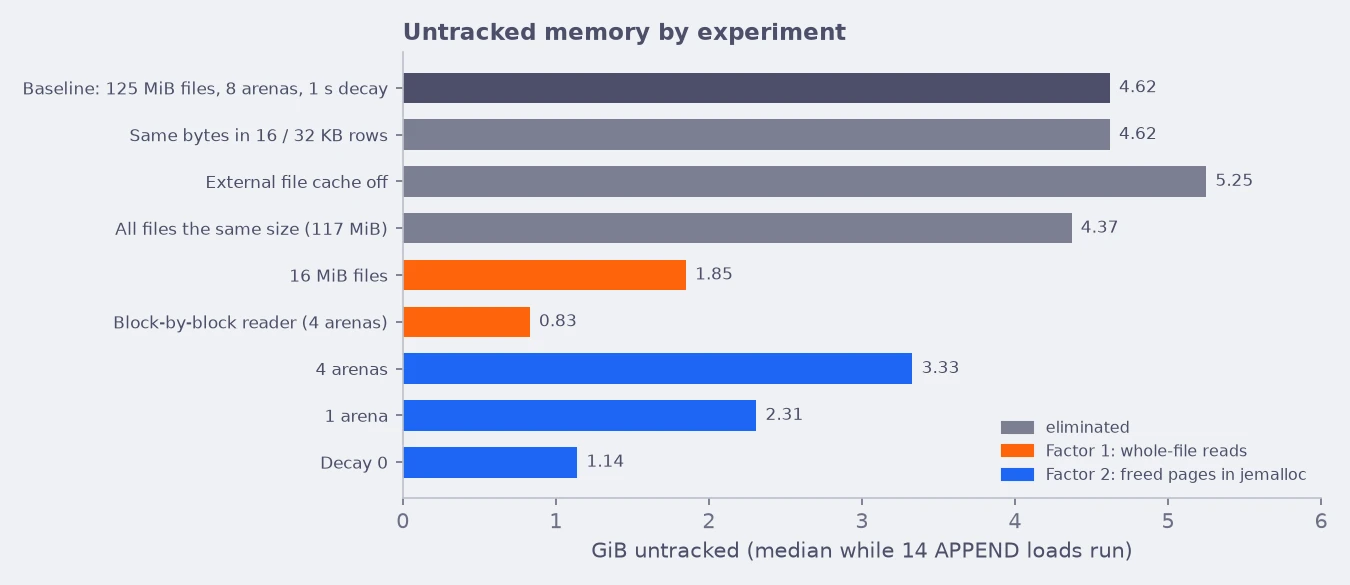
Parallel loads amplify both. Each load holds its own file buffers, and each finished file leaves freed pages behind. In APPEND loads, untracked memory was 3.2 GiB with 7 parallel loads and 4.6 GiB with 14.
Removing either factor prevented the kill: reading Avro one block at a time, or returning freed pages at once (decay 0).
How We Measured
Initial experiments suggested that memory growth was related to concurrency or the dataset. So we eliminated factors such as row width, DuckDB’s external file cache and glibc’s allocator settings.
Bench setup for all runs:
- Host: 8 vCPUs, 61 GiB
- Container: 18.5 GiB, 4 vCPUs
- JVM heap: 1.5 GiB, fixed
memory_limit: 13.5 GiB- DuckDB threads: 4
- Parallel loads: 14 (7 in one comparison)
The kernel counts all memory in the container against its limit, whether the JVM, DuckDB or an extension allocated it. Every second, we sampled:
- Container memory: anonymous memory in the cgroup (
memory.stat,anon). This is what the kernel kills on. - DuckDB’s tracked memory:
duckdb_memory(), summed over its components. - The JVM: Java Native Memory Tracking. The heap is fixed and pre-touched, so it is flat.
Untracked memory is container memory minus DuckDB’s tracked memory minus the JVM.1 In one run, untracked memory was 4.4 GiB when the kernel killed the container.
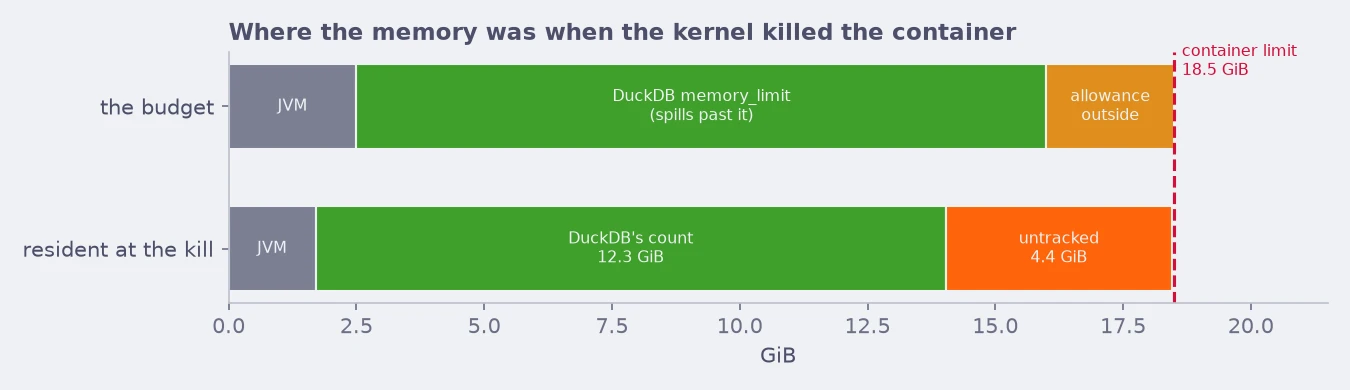
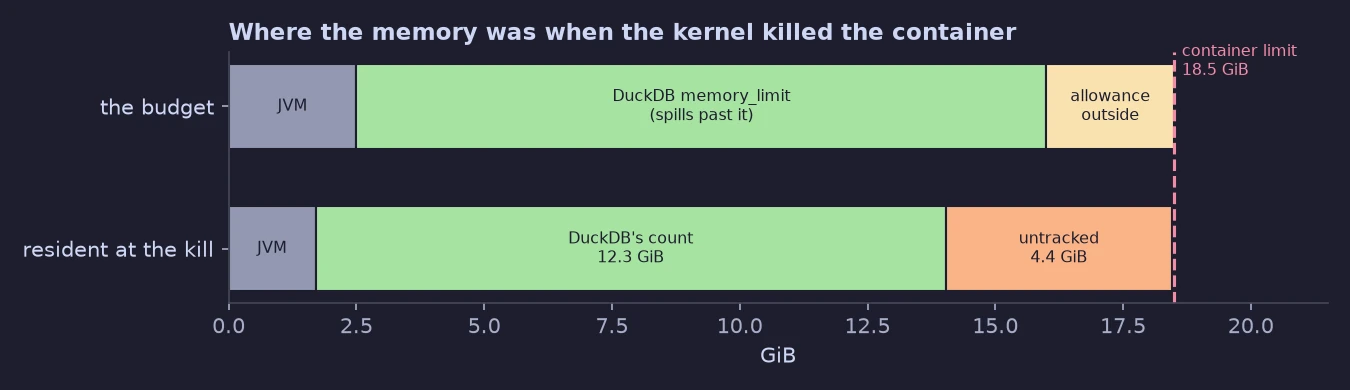
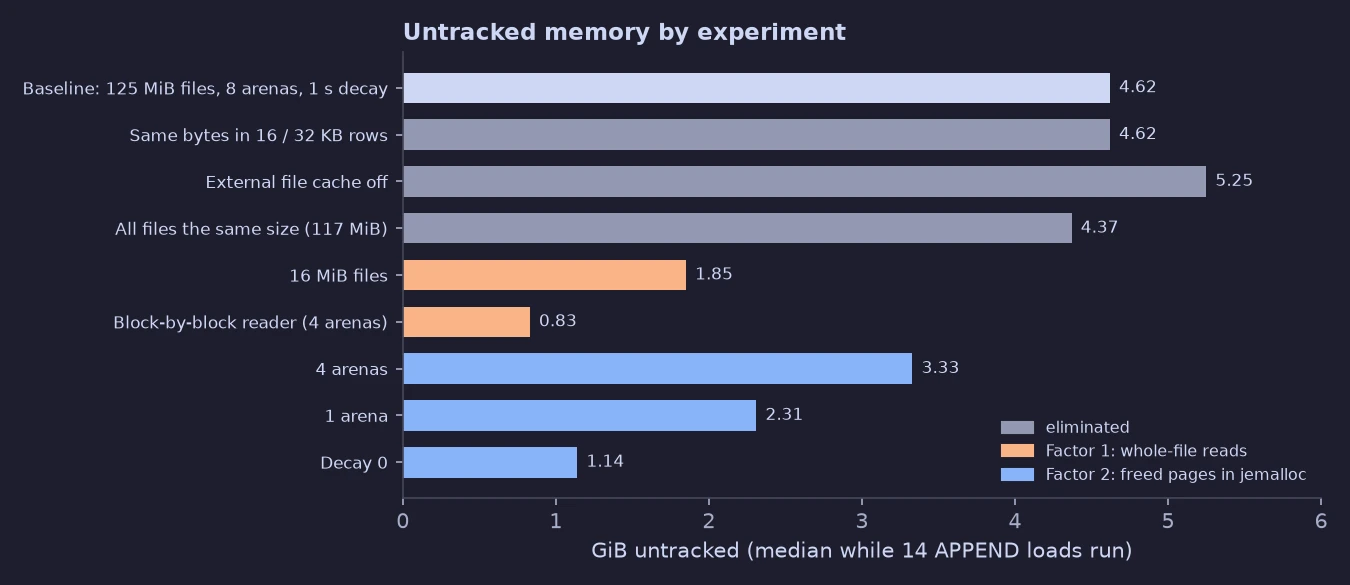
An overview of all the experiments, measured in APPEND loads so that no run was killed:
Factor 1: Whole-File Reads
Evidence
jemalloc prints its statistics at exit when DUCKDB_JE_MALLOC_CONF includes stats_print:true. The output showed
two jemalloc instances: DuckDB core’s, and the Avro extension’s own copy.
Each table’s batch was 8 Avro files: seven of 125 MiB and one of 62 MiB. jemalloc rounds a request up to its size class, so these show up as 128 MiB and 64 MiB allocations. In one run of 14 APPEND loads, the Avro extension’s allocator made these large allocations:
| Size | Count | Total |
|---|---|---|
| 128 MiB | 112 | 14.0 GiB |
| 64 MiB | 14 | 0.9 GiB |
- Each allocation is one file read: 14 tables of 8 files, and each table reads one of its files twice.
- The allocator made no other allocation of 256 KiB or more.
- If every load has one file open, the live buffers alone are 1.7 GiB.
The same dataset was rewritten in 16 MiB chunks of Avro files. The measurement showed that the allocation was proportional to individual file sizes:
| Avro files per table | Avro allocator’s large allocations | Untracked memory | Freed pages held until decay |
|---|---|---|---|
| 7 × 125 MiB + 1 × 62 MiB | 112 × 128 MiB, 14 × 64 MiB | 4.6 GiB | 4.0 GiB |
| 60 × 16 MiB | 854 × 16 MiB | 1.85 GiB | 0.6 GiB |
The Avro allocator handles about the same 13–15 GiB in both runs. Smaller buffers cost less while live, and once freed they are reused instead of waiting for decay.
Fix: Read Avro One Block at a Time
An Avro file is a header followed by blocks. Each block starts with its row count and byte size and ends with a 16-byte sync marker. The extension already scans a file in parallel by block: it builds an index of block offsets when the file opens, and each thread claims a block and decodes it. Only the index needs the whole file; decoding needs one block.
So we changed the reader to stream blocks to the threads. avro-c gets a positional read callback instead of a buffer:
typedef int (*avro_file_read_at_t)(void *ctx, int64_t offset, void *buf, int64_t len);

int avro_file_reader_streaming(avro_file_read_at_t read_at, void *ctx,
                               int64_t file_size, avro_file_reader_t *reader);
- The header is parsed from a 256 KiB prefix, doubled until the schema fits.
- The block index is built by walking the file in 1 MiB windows, reading each block’s two length fields and its sync marker and skipping its data.
- Each scan thread reads only the block it claims, into a buffer it reuses.
On the DuckDB side the callback is a positional read on a file handle opened for parallel access:
static int AvroReadAt(void *ctx, int64_t offset, void *buf, int64_t len) {
	auto &handle = *static_cast<FileHandle *>(ctx);
	try {
		handle.Read(buf, NumericCast<idx_t>(len), NumericCast<idx_t>(offset));
		return 0;
	} catch (std::exception &ex) {
		avro_set_error("%s", ex.what()); // no exception may cross into C
		return EIO;
	}
}
Block scheduling is unchanged. The change is about 300 lines of C in avro-c and 25 lines in the extension, and the extension’s existing tests pass.2
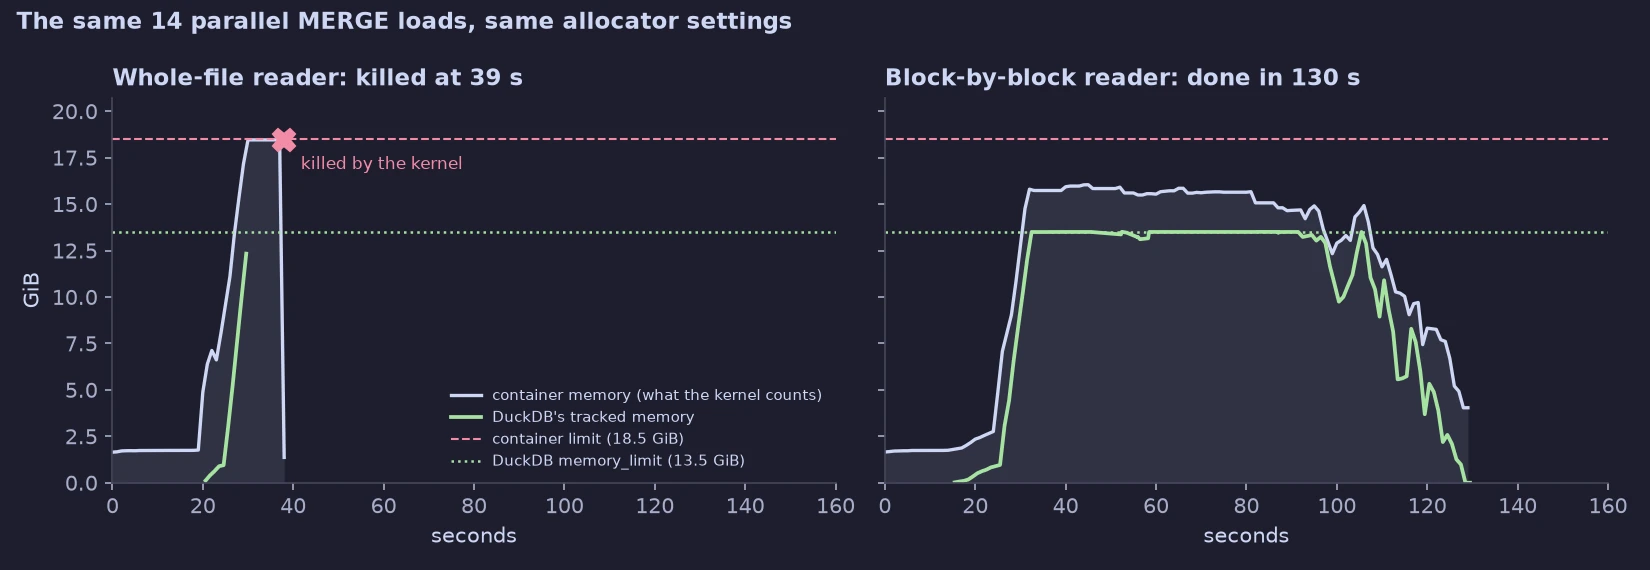
The same 14 MERGE loads of 125 MiB files, with the released reader and with the block-by-block reader:
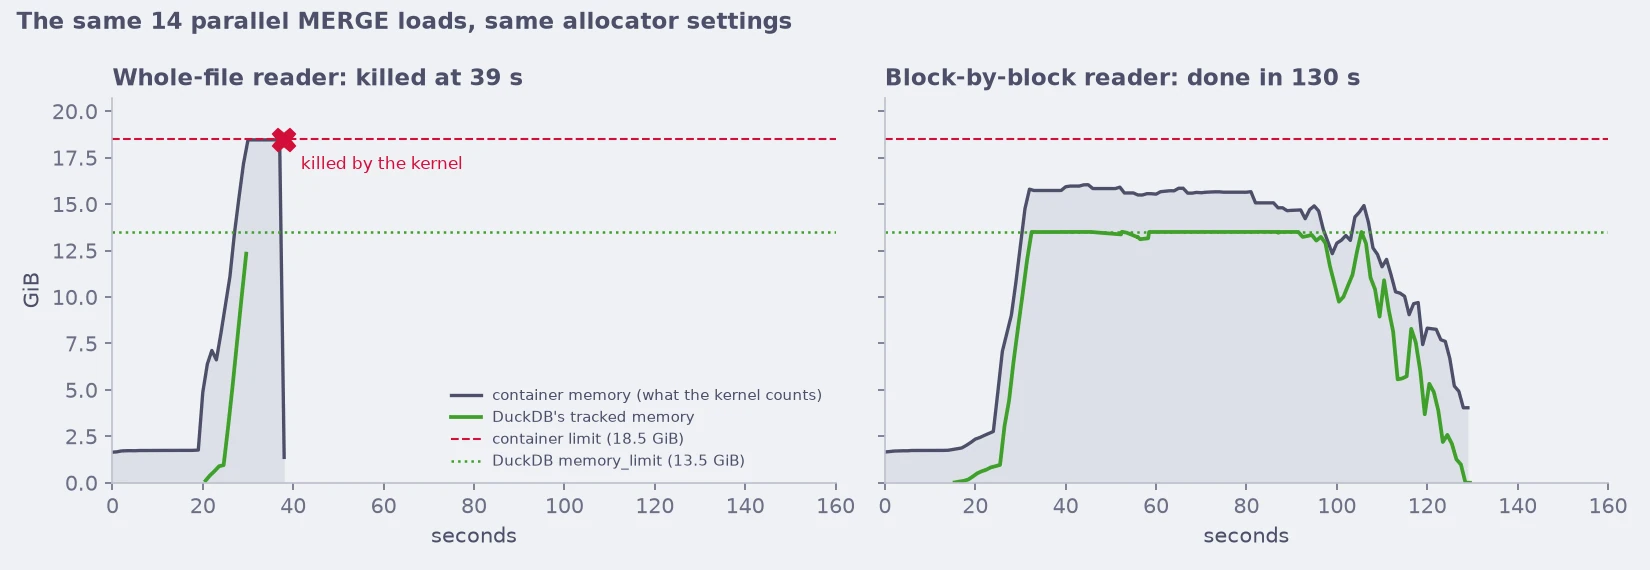
- MERGE: the released reader was killed in both runs. The block-by-block reader completed both, at 16 GiB of the
18.5 GiB container. DuckDB filled its
memory_limitand spilled 7–9 GiB to disk. - APPEND: peak container memory fell from 10.2 to 6.9 GiB and untracked memory from 3.5 to 0.8 GiB, in about the same time (about 50 s).
- The Avro extension’s allocator made no large allocations, against 14.9 GiB with the released reader.
- If the loads do not fit even with spilling, DuckDB fails with its own
Out of Memory Error, which the caller can retry, instead of the kernel killing the process.
Factor 2: Freed Pages in jemalloc
Evidence
To test the second factor, we kept the 125 MiB files and changed only jemalloc’s settings through
DUCKDB_JE_MALLOC_CONF. Untracked memory while 14 APPEND loads ran:
| jemalloc setting | Untracked memory |
|---|---|
| DuckDB’s default: 8 arenas, 1 s decay | 4.6 GiB |
| 4 arenas | 3.3 GiB |
| 1 arena | 2.3 GiB |
| Decay 0: freed pages returned at once | 1.1 GiB |
- Decay 0 removes most of it. What is left is roughly the file buffers that are live at any moment.
- Fewer arenas help but do not remove it. Freed memory is reused only within its own arena, so with more arenas more of it sits unused.
- Making every file the same size (117 MiB) did not help (4.4 GiB). Freed buffers were not left unused because they were the wrong size.
Fix: Return Freed Pages at Once
Both jemalloc settings are one environment variable away. The 14-load MERGE with the released reader and 125 MiB files:
| jemalloc setting | Outcome | Peak container memory | Time |
|---|---|---|---|
| DuckDB’s default: 8 arenas, 1 s decay | killed | 18.5 GiB (the limit) | — |
| 4 arenas | killed | 18.5 GiB (the limit) | — |
| 1 arena | completed | 17.9 GiB | 199 s |
| Decay 0 | completed | 16.2 GiB | 150 s |
Of the two settings, decay 0 is the one to use. It turned six kills out of six into completed runs, with no visible cost in load time:
DUCKDB_JE_MALLOC_CONF=dirty_decay_ms:0,muzzy_decay_ms:0One arena also completes, but with only 0.6 GiB to spare, and every thread then shares one arena’s locks.
Neither setting removes the whole-file buffers. They only stop freed ones from piling up.
Closing Thoughts
Decay 0 is easy to put in production: it is one environment variable. But it has costs:
- Every free returns pages to the kernel, so there are more system calls and more contention on jemalloc’s locks. We did not see a time cost in our runs, but we measured one workload.
- It changes jemalloc’s behaviour for every allocation DuckDB makes, not just the Avro buffers. That may have consequences we did not measure.
Reading Avro one block at a time is the better fix. It removes the allocation instead of cleaning up after it, and it works with DuckDB’s default allocator settings. But it has to be filed, merged and released in duckdb-avro before it is available.
The decay-0, row-width and file-cache numbers come from earlier runs on an identical machine. The released and block-by-block readers were compared with jemalloc’s default decay and 4 arenas. Most configurations ran twice, on one workload: 64 KB rows in uncompressed Avro. ↩︎
The change is on a fork of duckdb-avro and its avro-c library, at the commit DuckDB v2.0.0 ships. A self-built extension is unsigned, so DuckDB loads it only with
allow_unsigned_extensions. ↩︎