While investigating JVM performance, we noticed a Java microservice taking unusually long to process tasks. Initial checks on common culprits—high CPU usage, memory, or I/O stats—yielded no clues. There was also no major GC activity except for long safe points. The only noticeably slow operation was Reaching Safepoint.
Safepoint "Cleanup", Time since last: 108368992163 ns,
Reaching safepoint: 269920385757 ns, Cleanup: 30677 ns, At safepoint: 142459 ns,
Total: 269920558893 ns
Notice that the JVM took 269 seconds to reach safepoint. On reaching safepoint, it executed the operation very fast.
To understand the issue, it is important to understand how JVM works as well as the tools that can be used to get information on the internals of the JVM.
JVM Monitoring Tools Link to heading
Async Profiler Link to heading
async-profiler can be used to sample CPU usage by all the threads in a JVM. The samples can be used
to generate timeline of where each thread in the JVM spent time including the methods and the
stack trace.
Async Profiler Readme
Documentation for async-profiler, a sampling CPU and memory profiler for Java.
async-profiler can output in multiple formats. The most useful one to triage CPU stalls is jfr.
profile format used by the JDK Flight Recorder. The jfr format collects data about the JVM as well as the Java application running on it. async-profiler can generate output in jfr format compatible with tools capable of viewing and analyzing jfr files. JDK Mission Control (JMC) and Intellij IDEA are some of many options to visualize jfr files.
Java Mission Control (JMC) Link to heading
JMC allows developers to analyze JVM runtime data captured in jfr format. In this case, JMC provides a clear visualization of where each thread is spending time, helping us pinpoint bottlenecks. The video provides an introduction to the capabilities of JMC.
SafePoints Link to heading
Time To Safepoint
Learn in more detail about Safepoints work in JVMs
Ref:
provides a good introduction to what Safepoints are.
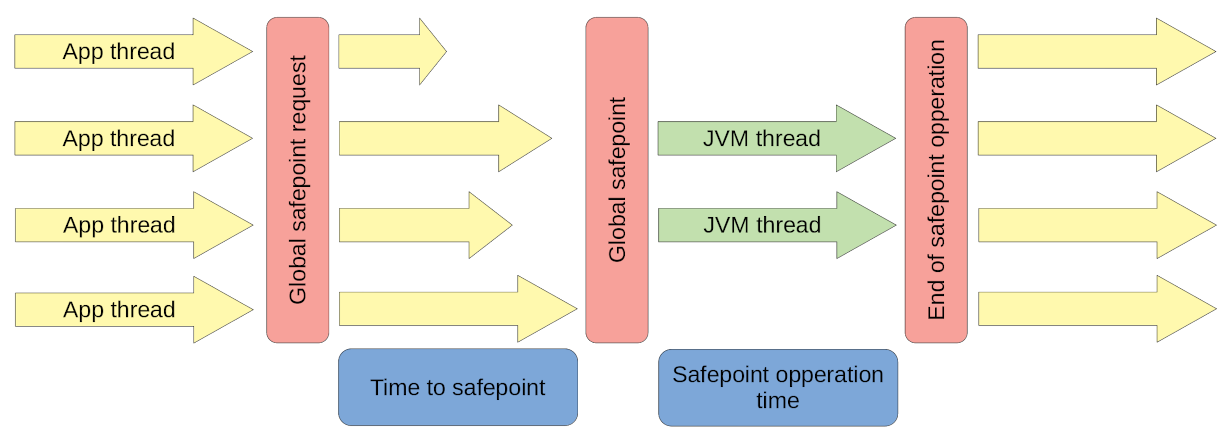
The above diagram shows the workflow to execute a JVM operation. VM threads require all threads to reach a safepoint so that some VM operation can be executed. Typically this involves some mutation of internal global data structures. Examples are:
- ZRendezvousClosure
- ShenandoahUnloadRendezvousClosure
- ZMarkFlushAndFreeStacksClosure
- InstallAsyncExceptionClosure
- RevokeOneBias
- DeoptimizeMarkedClosure
- NMethodMarkingClosure
Time to safepoint is the interesting phase for this triage. Once a global request is sent out, all threads will reach safepoint at different times. The total time taken is determined by the slowest thread. So in this instance, some thread took 269 seconds to respond to the global safepoint request. One of the most common reasons for delayed Safepoint reachability is blocking I/O operations.
Triage Safepoint Stall using async-profiler and JMC Link to heading
JMC can visualize timelines of all the threads sampled by async-profiler. One of the threads
is VM Operations. This is a system thread that executes JVM internal operations including those
that require Safepoints.
One of the thread lanes shows VM operations. The phases in blue are for “Reaching SafePoint” and the phases in red for “HandshakeAllThreads” - another Stop The World Phase.
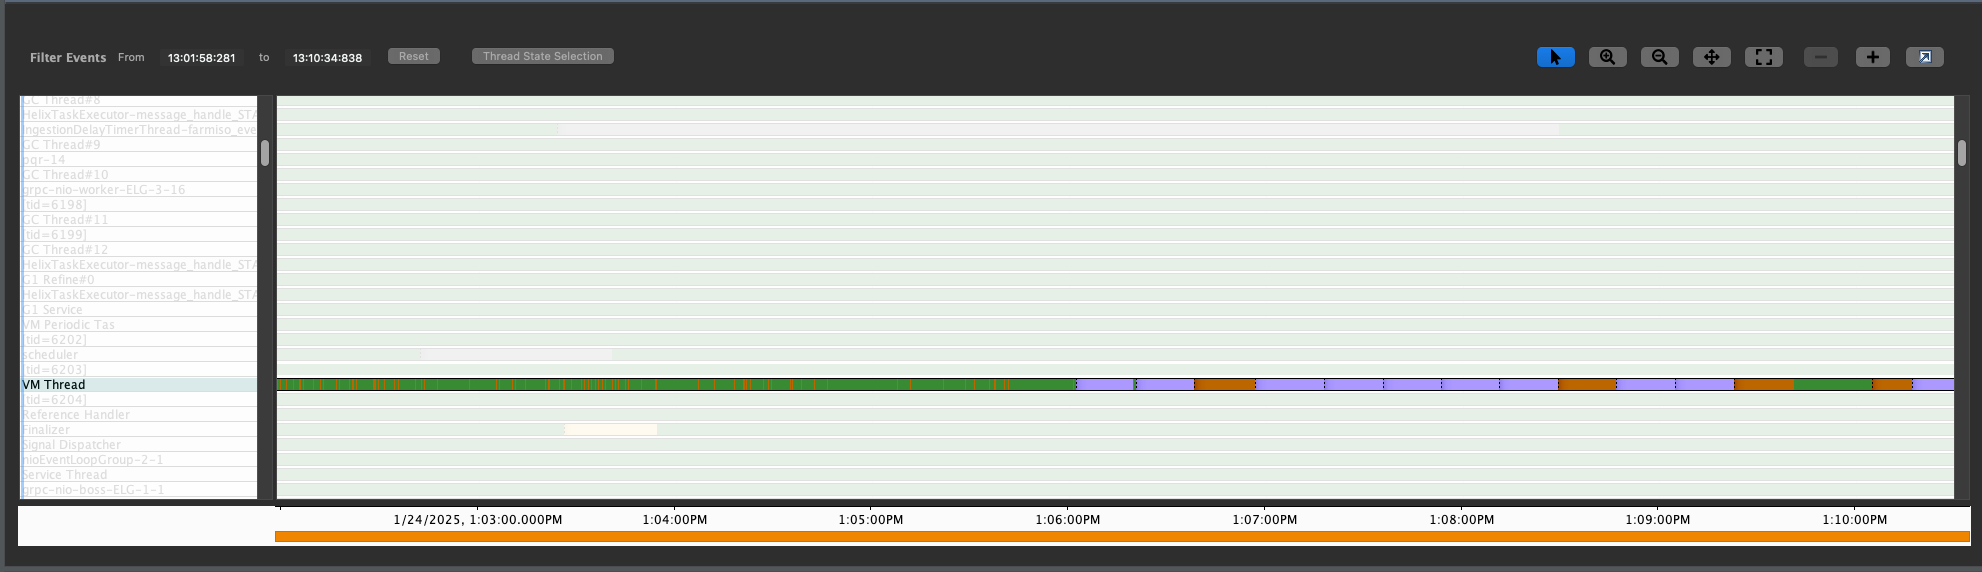
There are application threads such as Log4J writer that do spend a lot of time in I/O operations. In the diagram, the dark phases are for FileWrite.

Check if Safepoint and I/O timelines align Link to heading
By juxtapositioning the timelines of VM Thread and other application threads, it can be seen that
Reaching Safepoint phases in the VM Thread align with I/O operations in application threads.
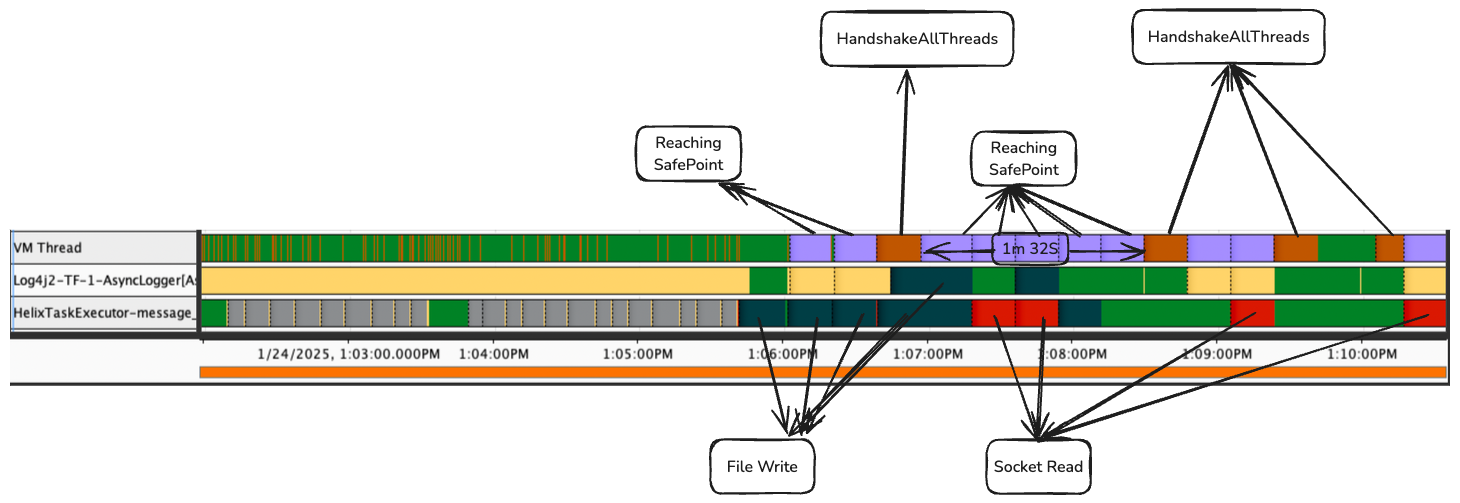
VM thread initiates Safepoint requests. There are two types of VM operations in the JFR as shown.
- Reaching Safepoint (blue)
- HandshakeAllThreads (red)
Each block is approximately 18 secs. Many of the “Reaching Safepoint” blocks are waiting for I/O. A few examples of I/O are shown in the diagram.
- File Write by AsyncLogger to log files.
- File Write by HelixTaskExecutor.
- Socket Read by HelixTaskExecutor. VM Thread reaches Safepoint as soon as the I/O is done.
Summary Link to heading
The timeline graphs conclusively show that JVM stalls are due to long phases of Reaching Safepoint
by the VM Thread. The long phases are due to threads spending a long time in I/O operations.
The next step is to work with the systems engineers to solve the long I/O operations.